Mangoes and Metrics
Designing Data Visuals and Stories for Impact
In a hypothetical small West African village, an NGO recently commemorated the second anniversary of planting 100 mango trees as part of its ambitious "Fruit for the Future" initiative.
The celebration included speeches, banners, and yes, a mango-shaped cake. When asked for an update on the project, the program officer beamed, "All 100 trees are still standing!"
Skipping past, the donor representative chimes in, clipboard in hand: "That’s great, but... are they fruiting? Are families eating better? Has anyone sold mangoes at the market?"
Dead silence… a pin dropped and we all heard it.
In all the excitement of planting and photo ops, no one had actually checked if the trees were producing mangoes. Or, more importantly, whether anyone was eating them.
That is the great divide between activity and impact, between what we do and why we do it.
The Metrics That Matter
For many NGOs, data collection is still stuck in "cowry-counting" mode: how many workshops held, how many trees planted. These are easy to measure but don’t capture real-world change.
But donors and communities are increasingly asking better questions:
Did this training improve livelihoods?
Did this health campaign reduce disease incidence?
Did this scholarship program help children finish school?
So, how can NGOs move from counting to connecting? From inputs and outputs to actual outcomes and long-term impact?
The IMPACT Framework
Here's a simple framework to design better data collection systems that tell meaningful stories:
Imagine the Ideal Outcome. Start with the big picture. What transformation are you trying to create? More girls in STEM? Better maternal health? What is the ideal outcome?
Match Your Moves to the Mission. Draw a clear line between what you do and what you hope to achieve. For example, "Planting 100 mango trees" should logically lead to "more families eating nutritious fruit, earning extra income at the market, and reducing food insecurity during mango season."
Pick the Juiciest (Mangoes)Metrics. Choose indicators that reflect meaningful change. Think: job placement rate, average increase in income, percentage of patients completing treatment. Go for quality over quantity.
Ask Like a Curious Cat. Design tools that don’t just collect data, they uncover stories. Use surveys, interviews, and focus groups. Ask not just "what happened?" but "why?" and "what changed?"
Connect the Dots. Share what you find with the people it affects. Don’t let your data disappear into dusty reports. Bring it full circle, use it to adapt, evolve, and empower.
Turn Stats into Stories. Data alone is dry. But when paired with lived experiences, it breathes. Instead of "100 trees planted," try: “Fatou used the mango harvest to start a juice stall that now pays for her children's school fees.”
Designing Visuals for Impact
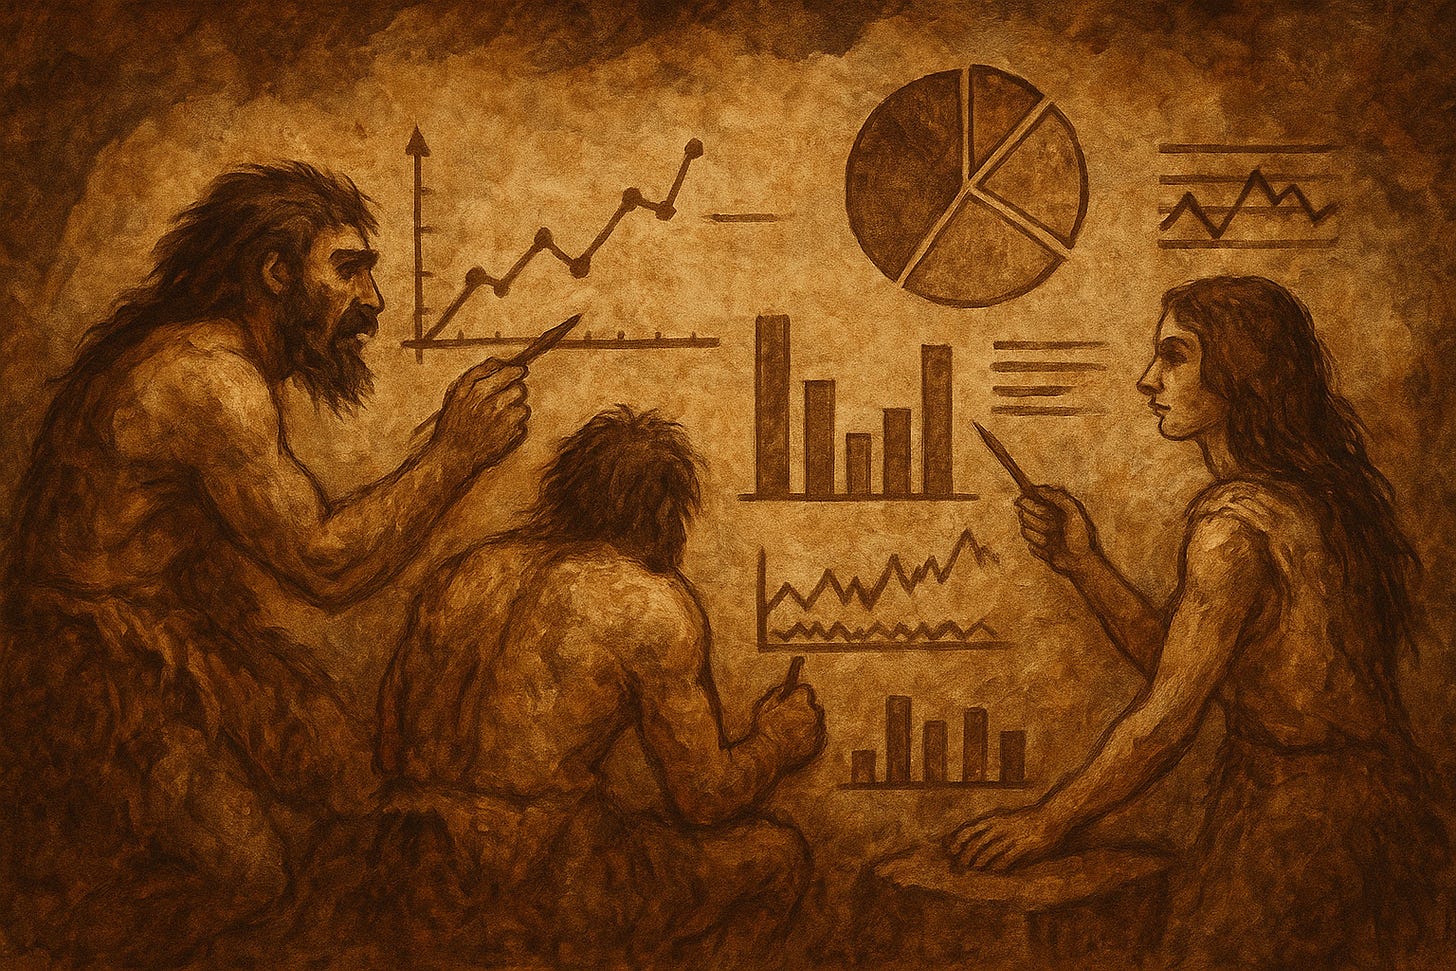
Here’s where the magic really happens: translating dry data into compelling visual and narrative forms. Visuals should illuminate, not overwhelm. Here are a few principles to guide your designs:
Clarity over complexity. Avoid data-dense spaghetti charts. Use simple bar graphs, line trends, or even number cards when appropriate.
Focus on change over time. Use before-and-after visuals or timelines to showcase progress.
Humanize the data. Add icons, photos, or illustrations that make abstract metrics more relatable.
Color with purpose. Use color strategically to highlight improvements or disparities, and ensure it's accessible for colorblind readers.
Choose the right tools. Platforms like Power BI, Tableau, Canva, Flourish, and even Looker Studio can help turn spreadsheets into share-worthy visuals.
Interactive tools like story maps and dashboards let your audience explore the data at their own pace. A well-designed heatmap or geospatial report can show, at a glance, where interventions are thriving or not.
Telling Stories for Impact
While numbers give you credibility, stories give you connection. To achieve a balanced scale;
Anchor each story in a person. Focus on individuals whose lives represent broader trends. "Meet Musa, who used a microloan to rebuild his fishing business."
Create a narrative arc. Introduce the context, show the challenge, explain the intervention, and end with the result.
Balance breadth and depth. Combine macro-level data with micro-level detail. "400 families gained access to clean water. Here’s what it meant for Kemi and her children."
Use the data as plot points. Let numbers move the story forward. "After three months, vaccination rates rose by 60%. That’s when we noticed..."
Quote your beneficiaries. Direct voices add authenticity and emotion.
When you put it all together, your reports don’t just document, they resonate. They become tools for advocacy, learning, and connection.
The rule of thumb? Don’t just collect data. Craft a narrative arc. Show where you started, what changed, and what’s still ahead.
From Reporting to Reflecting
Sipping on my mango-infused lemonade while waiting patiently for my meal in a cozy Budapest eatery, I couldn’t help but reflect on how even a fruit can spark a whole conversation about impact.
Measuring impact isn’t about ticking boxes for donors. It’s about honoring the beneficiaries we serve. It’s about asking, "Is this really working?" and being brave enough to change course if it isn't.
If we want to move beyond mango trees that merely stand, to mango trees that feed and sustain, we need to rethink how we track success.
Because in the end, the best metric isn’t how many trees were planted. It’s how many lives they nourished.
So here’s your call to action: Don’t let your data just stand there like a quiet mango tree. Make it blossom. Make it fruit. And most of all, make it impact futures worth celebrating.


Quite relatable and eye opening.
Reports are rolled out, as a display of work being put in. But it is only truly impactful if meaningful & honest indicators are applied.
Lesson learned: Our mango trees shouldn't only be used as shade from the Sun. Our mango trees should be the cornerstone for learning, re-learning, change, development & advancement.
This is an absolute relatable read. Well done Louis 👏